
- Reported purchase price
- $440M
- Reported apartments
- 928
- Price per apartment
- $474K
59 San Francisco apartment buildings
About 15.7 units per building on average
Reported price divided by reported units
Data: Reported portfolio transaction as of November 4, 2026; Rent Board housing-inventory methodology checked November 8, 2026.
A $440 million apartment sale makes an easy headline. The more useful number is $474,138 per unit, and even that number is only the beginning of the underwriting.
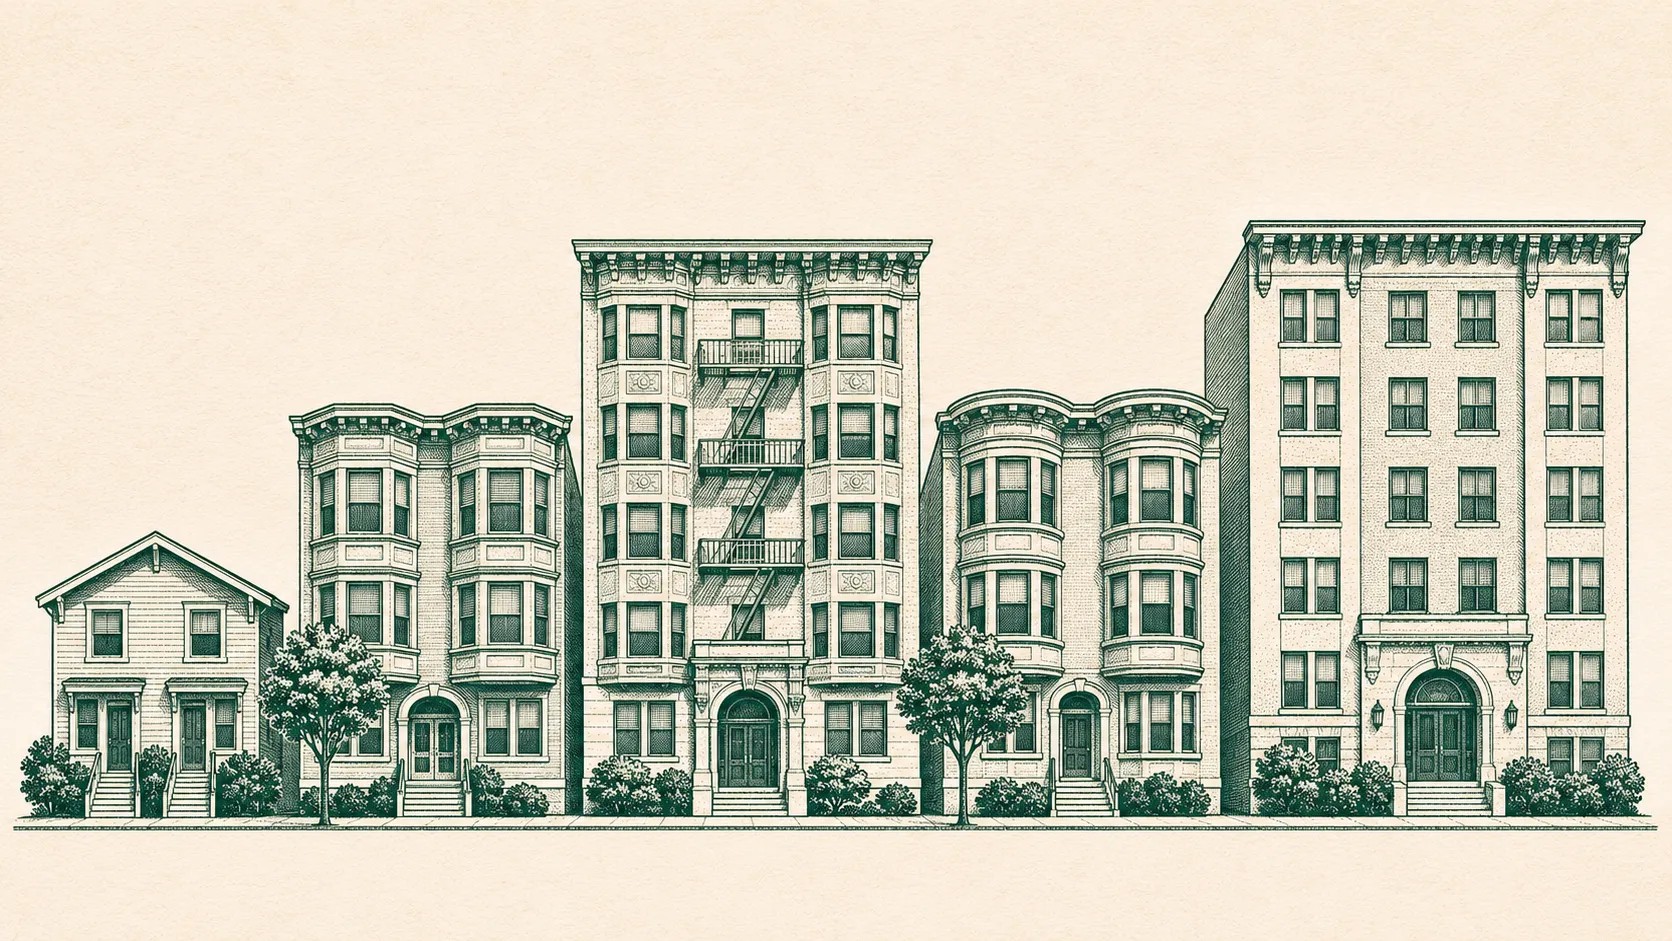
Fort Point Real Estate Partners reportedly bought 59 San Francisco residential buildings containing 928 apartments. The portfolio spans neighborhoods from Pacific Heights and Russian Hill to Hayes Valley and the Haight. The Registry reported that the basis was about 19% below the prior owners’ cost per unit.
My read is simple: the sale confirms that large buyers will put serious capital into San Francisco apartments at the right basis. It does not establish a citywide value per unit, prove a market bottom, or tell you whether a particular building will cash flow.
Start with the arithmetic
| Measure | Calculation | Result |
|---|---|---|
| Price per apartment | $440,000,000 ÷ 928 | $474,138 |
| Average apartments per building | 928 ÷ 59 | 15.7 |
| Average price per building | $440,000,000 ÷ 59 | $7,457,627 |
The averages describe the portfolio as reported. They do not describe the size, rent, condition or value of any individual building.
The $7.46 million average building price is nearly useless without the building mix. A 16-unit property in Nob Hill and a four-unit property in the Haight can share one portfolio but have completely different legal rents, expense loads, seismic work and debt capacity. The 15.7-unit average does not mean the portfolio contained 59 similar 16-unit buildings.
The same problem applies to the reported 19% discount from the prior owners’ cost per unit. The current purchase is a 59-building subset of a larger portfolio that went through a deed in lieu. Without a matched list of properties and their original allocations, that percentage is useful context, not a same-property appreciation index.
What NOI would support a $474,138 basis?
Price per unit becomes more useful when you connect it to income. If one apartment carries $474,138 of purchase price, the annual NOI needed to produce a 3.5%, 4.5% or 5.5% unlevered cap rate is just price multiplied by the target cap rate.
Illustrative threshold using the reported $440 million price divided by 928 apartments. This is not the portfolio’s reported NOI or cap rate.
| Target cap rate | Annual NOI per apartment | Monthly NOI per apartment | Calculation |
|---|---|---|---|
| 3.5% | $16,595 | $1,383 | $474,138 × 3.5% |
| 4.5% | $21,336 | $1,778 | $474,138 × 4.5% |
| 5.5% | $26,078 | $2,173 | $474,138 × 5.5% |
NOI is after ordinary operating expenses and before debt service, income tax, depreciation and major capital projects. Monthly NOI is annual NOI divided by 12, not monthly rent.
At a 4.5% cap rate, the reported basis needs about $21,336 of annual NOI per unit, or $1,778 a month. That is not the rent target. Gross rent must also cover vacancy, collection loss, property tax, insurance, utilities, repairs, management and the rest of the operating budget before it becomes NOI.
This is why I would not take a citywide rent headline and back into a valuation. A rent-controlled unit with a long tenancy can collect far less than a renovated vacancy in the same building. Two buildings on the same block can also carry different property-tax bases, insurance histories and deferred work.
The real investment thesis is operating income
Fort Point’s earlier company announcement described a strategy of seismic and fire-life-safety work, unit and common-area renovations, and activating underused retail. That is more informative than the portfolio average because it points to where the buyer expects to spend money and create value.
We focus on cash-flowing investments. Better operations, lower vacancy, disciplined expenses and well-chosen capital work can improve recurring NOI. When that cash flow becomes more durable, the asset itself can appreciate. That is a much stronger plan than relying on market appreciation or rent growth above inflation, both of which sit outside the owner’s control.
The recurring mistake in San Francisco multifamily is to count the future twice: first as a higher rent, then again as a lower cap rate. If the acquisition only works when rents jump and the market pays more for each dollar of NOI, the margin of safety is imaginary.
What the portfolio headline leaves out
| Missing input | Why it matters | What to verify |
|---|---|---|
| Actual rent roll | Legal collected rent drives the base case | Leases, ledgers, concessions, arrears and occupancy dates |
| Operating expenses | The same gross rent can produce very different NOI | Taxes, insurance, utilities, payroll, repairs, management and compliance |
| Capital plan | Older buildings can consume years of cash flow | Seismic, fire safety, roofs, electrical, plumbing, elevators and unit turns |
| Debt terms | Leverage can turn acceptable NOI into negative cash flow | Rate, amortization, maturity, reserves and required DSCR |
| Property mix | A portfolio average hides dispersion | Address-level unit count, location, use, condition and tenancy |
| Allocation of price | One headline price does not value 59 assets equally | Asset-level purchase-price allocation and lender appraisal |
The SF Rent Board Housing Inventory is useful diligence context, but it is owner-submitted and changes daily. The city says each row is a housing unit and warns analysts to count unique IDs within a selected reporting year rather than summing rows. It is a record to reconcile against leases and property files, not a substitute for them.
How I would use this sale on a smaller deal
- Calculate the subject property’s price per legal unit, but do not stop there.
- Build current NOI from documents, not market rent or a broker’s blended pro forma.
- Divide current NOI by price and compare the resulting cap rate with truly similar closed sales.
- Add a separate five-year capital schedule and cash reserve. Do not hide major work inside an expense ratio.
- Run debt service using a property-specific quote and a higher-rate downside case.
- Show renovation, vacancy and rent-reset opportunities separately from the base case.
- Decide whether the building works with flat real rents. Treat market appreciation as upside.
Our investment-property underwriting guide explains the full workflow. The San Francisco cap-rate calculator lets you test the actual rent roll, vacancy, expenses and debt, and the multifamily loan guide explains why the financing line changes at five units.
My conclusion
The $440 million sale is a strong vote for San Francisco apartment ownership, but it is not a shortcut to valuation. The headline basis tells you where to start asking questions. The rent roll, capital plan and debt tell you whether the investment works.
I would rather buy one building with defensible current cash flow than 59 buildings that need the market to rescue the model.
Common questions
How much did the reported San Francisco apartment portfolio cost per unit?
Approximately $474,138 per apartment, calculated as the reported $440 million purchase price divided by 928 apartments.
Does $474,000 per unit establish the value of my apartment building?
No. It is a portfolio average. Your building’s legal rents, expenses, location, unit mix, condition, capital work and financing determine whether a similar basis is supportable.
What NOI supports a 4.5% cap rate at that price per unit?
About $21,336 per apartment per year, or $1,778 per month. That is NOI after ordinary operating expenses, not gross rent.
Was the portfolio sold 19% below its old value?
The Registry reported a price per unit about 19% below the prior owners’ cost. The purchased assets were a subset of a larger earlier portfolio, so that comparison is not a same-property appreciation measure.
Methodology
The reported price per apartment is $440,000,000 ÷ 928 = $474,137.93. Average apartments per building is 928 ÷ 59 = 15.73, and average price per building is $440,000,000 ÷ 59 = $7,457,627.12. Required NOI per apartment equals $474,137.93 multiplied by the selected cap rate: $16,594.83 at 3.5%, $21,336.21 at 4.5%, and $26,077.59 at 5.5%. Monthly NOI divides each annual figure by 12. These are calculations from reported aggregate figures, not asset-level values, appraisal conclusions, the buyer’s actual NOI, or the transaction’s cap rate. The reported 19% comparison is not treated as same-property appreciation because the current purchase is a subset of a larger earlier portfolio.
Sources
- San Francisco Business Times · Nearly 1,000 apartments sell for $440 million, November 4, 2026 ↗
- The Registry · Fort Point buys 59-building, 928-unit San Francisco portfolio, November 4, 2026 ↗
- Fort Point Real Estate Partners · Company launch and investment strategy, December 10, 2025 ↗
- DataSF · Rent Board Housing Inventory, updated November 5, 2026 ↗
- SF Rent Board · Housing Inventory requirements and annual reporting ↗