
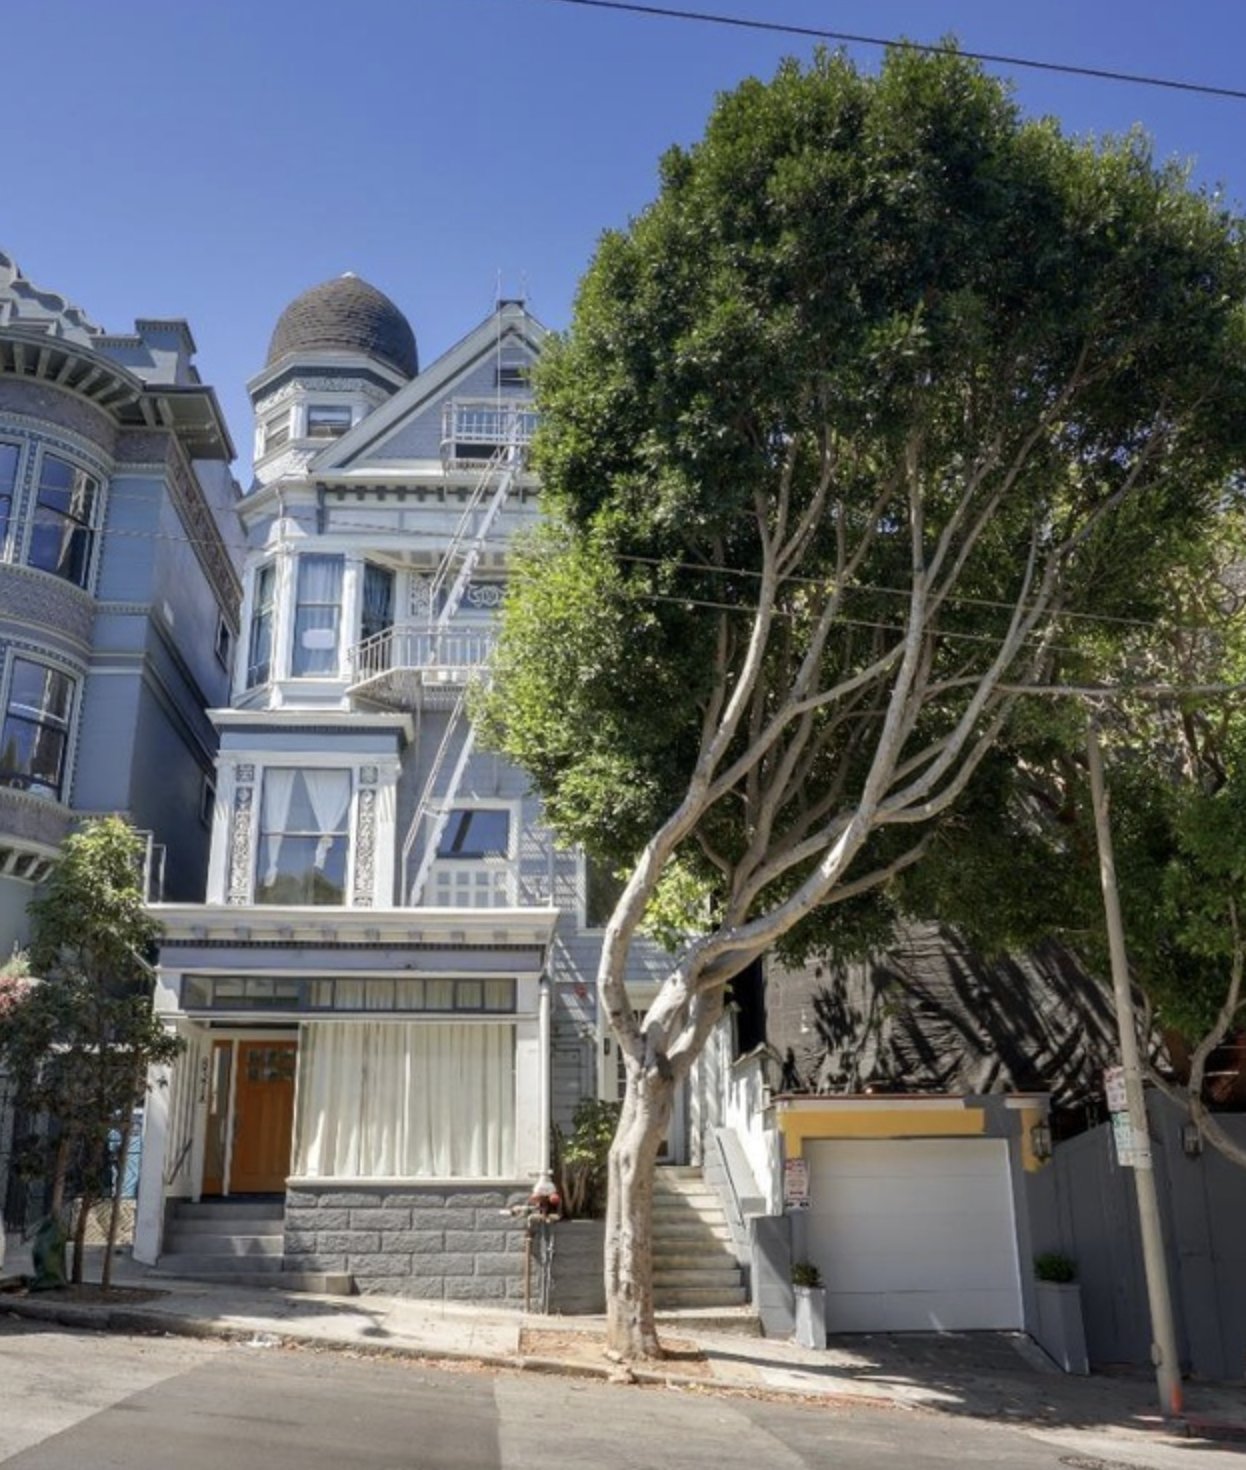
- Multifamily case studies
- 4
- Apartments in those buildings
- 20
- Building size range
- 2–9 units
Selected historical buildings in the portfolio
Documented counts across the four records
Within this curated multifamily sample
Data: MLS sales through October 22, 2026; ZIP figures pool January 2024 onward. Portfolio examples are historical.
Define the investment
Clarify the property type, purchase budget, available reserves, expected holding period, and how much involvement you want in operations.
Verify the records
Request the current rent roll, leases, operating statements, expense records, building reports, and available permit history. Distinguish documented facts from seller estimates.
Compare scenarios
Review income, expenses, financing, vacancy, maintenance, and major capital work under more than one scenario. Label every assumption and avoid treating projected returns as assured results.
Bring in the right specialists
Use qualified lending, tax, legal, inspection, and property-management professionals for the issues that require their expertise. Resolve material questions before making a commitment.
The 2–4-unit and 5+-unit purchase markets differ
| MLS building size | Closed sales | Median price | Median price / unit | Median reported cap rate | Sales reporting a cap rate | Median days on market | Median sale / final list |
|---|---|---|---|---|---|---|---|
| 2-4 units | 368 | $2,055,000 | $770,000 | 4.63% | 194 | 16 | 106.8% |
| 5+ units | 134 | $2,830,000 | $365,000 | 5.68% | 121 | 43 | 97.1% |
TurboHome MLS analysis [M]. San Francisco closed sales through October 22, 2026. 2026 YTD is January 1–October 22; earlier years are full calendar years. Different sale samples, not matched-property appreciation. Cap rates are listing-reported for the stated subset, with values restricted to 0%–20%. They are not independently underwritten operating yields. The price-per-unit median is its own statistic, not median building price divided by an assumed unit count.
TurboHome MLS analysis [M]. San Francisco closed sales through October 22, 2026. 2026 YTD is January 1–October 22; earlier years are full calendar years. Different sale samples, not matched-property appreciation.
The 2026 YTD median price per unit is $770,000 for 2–4-unit income listings and $365,000 for 5+-unit listings. That gap is not an automatic conversion profit: unit size, tenancy, condition, legal status, operating costs, financing and location differ. The MLS size classification must also be checked against the lender’s accepted legal unit count. [M]
ZIP-level income-property comparisons need sample sizes
| ZIP and source area label | Closed sales | Median price / unit | Cap-rate observations | Median reported cap rate |
|---|---|---|---|---|
| 94102 · Civic Center / Tenderloin / Hayes Valley | 13 | $335,000 | 10 | 6.53% |
| 94103 · SoMa | 22 | $273,000 | 20 | 7.27% |
| 94115 · Western Addition / Pacific Heights | 31 | $354,000 | 26 | 5.80% |
| 94117 · Haight-Ashbury / Western Addition | 52 | $369,000 | 51 | 5.88% |
Window: January 1, 2024–October 22, 2026, not 2026 YTD. ZIPs cover multiple neighborhoods. Samples below 20 are directional, especially the 13 sales and 10 cap-rate observations in 94102. These are reported cap rates, not net returns or evidence of rent growth. [M]
A transfer-tax threshold can change the exit budget
| Sale consideration | General rate per $500 or portion | Estimated tax on full consideration |
|---|---|---|
| $4,999,999 | $3.75 | $37,500 |
| $5,000,000 | $11.25 | $112,500 |
The general schedule applies the selected tier to the full consideration. Estimates exclude exemptions, special caps and entity-transfer rules. Confirm the transaction with title/escrow. [T]
At the general schedule, $4,999,999 produces an estimated $37,500 transfer tax, while $5 million produces $112,500. Model the $75,000 difference in net proceeds before comparing offers or exit prices. The supplied MLS sample records 41 sales at $4,975,000–$4,999,999 and one at $5,000,000–$5,024,999 from January 2023 through October 22, 2026. That bunching is consistent with threshold incentives, but it does not establish the reason for each negotiated price. [M, T]
Five selected prior properties from Caley Zheng’s portfolio. This is a curated sample, not a representation of the San Francisco market.
What changes a building’s income?
Adjust the assumptions and watch the scorecards and chart respond. These are illustrative planning examples, not market data or actual property results.
- Scheduled annual rent
- $180,000
- Annual net operating income
- $111,150
- Illustrative cap rate
- 3.71%
Before vacancy and expenses
Before debt service and income taxes
NOI divided by purchase price
Expenses are a share of income after vacancy. This simplified illustration excludes financing, income taxes, and capital expenditure reserves. Replace assumptions with verified property records.
Methodology
MLS context is supplied by TurboHome. Annual figures are full calendar years and 2026 YTD ends October 22. ZIP tables pool January 2024 through October 22, 2026. Cap-rate medians use only the stated reporting subsets and do not establish rents or property returns. General transfer-tax calculations were checked against the official affidavit; exemptions and special caps are excluded. Portfolio counts are drawn from the linked case studies: Dolores 5 units, Birch 2, Fillmore 9, and Linden 4. Waller is a single-family home and is excluded from the multifamily scorecards. The editable income tool uses hypothetical rents and costs; it does not report actual operating performance.
Sources
- 139–143 Dolores Street · Caley Zheng’s case study ↗
- 527–529 Birch Street · Caley Zheng’s case study ↗
- 837 Fillmore Street · Caley Zheng’s case study ↗
- 521–527 Linden Street · Caley Zheng’s case study ↗
- 261 Waller Street · Caley Zheng’s case study ↗
- [M] TurboHome MLS sales analysis, extracted October 23, 2026; aggregates and methodology ↗
- [T] SF Assessor-Recorder transfer-tax affidavit, general schedule and special caps ↗
Explore the neighborhoods.
Pair your buying or investment research with local places and neighborhood market data.
- Mission District neighborhood guide ↗Mission District market update ↗
- Bernal Heights neighborhood guide ↗Bernal Heights market update ↗
- Marina District neighborhood guide ↗Marina District market update ↗
- Cow Hollow neighborhood guide ↗Cow Hollow market update ↗
- Potrero Hill neighborhood guide ↗Potrero Hill market update ↗
- Inner Sunset neighborhood guide ↗Inner Sunset market update ↗
- Outer Sunset neighborhood guide ↗Outer Sunset market update ↗
- Outer Richmond neighborhood guide ↗Outer Richmond market update ↗
- Cole Valley neighborhood guide ↗Cole Valley market update ↗
- Glen Park neighborhood guide ↗Glen Park market update ↗
- Castro neighborhood guide ↗Castro market update ↗
- Lower Haight neighborhood guide ↗Lower Haight market update ↗
- Alamo Square neighborhood guide ↗Alamo Square market update ↗
- Lower Pacific Heights neighborhood guide ↗Lower Pacific Heights market update ↗
- Presidio Heights neighborhood guide ↗Presidio Heights market update ↗
- West Portal neighborhood guide ↗West Portal market update ↗
- South Beach neighborhood guide ↗South Beach market update ↗
- North Beach neighborhood guide ↗North Beach market update ↗
- Haight-Ashbury neighborhood guide ↗Haight-Ashbury market update ↗
- Bayview neighborhood guide ↗Bayview market update ↗
- Inner Richmond neighborhood guide ↗Inner Richmond market update ↗
- Nob Hill neighborhood guide ↗Nob Hill market update ↗
- Rincon Hill neighborhood guide ↗Rincon Hill market update ↗
- Russian Hill neighborhood guide ↗Russian Hill market update ↗
- Hayes Valley neighborhood guide ↗Hayes Valley market update ↗
- Noe Valley neighborhood guide ↗