
- SF condo $/sq ft change
- +12.4%
- SF median days on market
- 15
- SF above original asking
- 57.8%
Same-ZIP comparison, Jan. 1 to Nov. 14, 2026 vs. 2025
2026 supplied summary, down from 30 in 2025
2026 supplied summary, up from 35.9% in 2025
Data: Owner-supplied condo sales summary through November 14, 2026. Q4 is partial.
San Francisco condos are pulling ahead of the suburban Bay Area after years of lagging behind. In owner-supplied sales analysis, San Francisco condo prices per square foot rose 12.4% from January 1 through November 14, 2026, compared with the same period in 2025. Every other county in the five-county comparison declined.
For a first-time buyer, the useful conclusion is that the old assumption of an easy San Francisco condo bargain needs updating. Competition has increased, but a citywide rebound is still a poor substitute for evaluating the specific home and its building. A purchase needs to work at today's price and monthly cost without depending on another year of appreciation.
Are San Francisco condo prices going up?
Yes, in the supplied 2026 same-ZIP price-per-square-foot comparison. San Francisco's 12.4% increase contrasts with declines of 1% to 7.1% across the four suburban counties.
| County | 2026 change in condo price per square foot |
|---|---|
| San Francisco | +12.4% |
| San Mateo | -1.0% |
| Contra Costa | -2.9% |
| Alameda | -4.2% |
| Santa Clara | -7.1% |
These figures compare January 1 through November 14 in both years. Same-ZIP comparisons help address geographic differences, but they are not repeat sales of identical homes. Changes in the units sold can still affect the results.
How the San Francisco and suburban condo markets switched places
Swipe or scroll horizontally to explore the full chart →
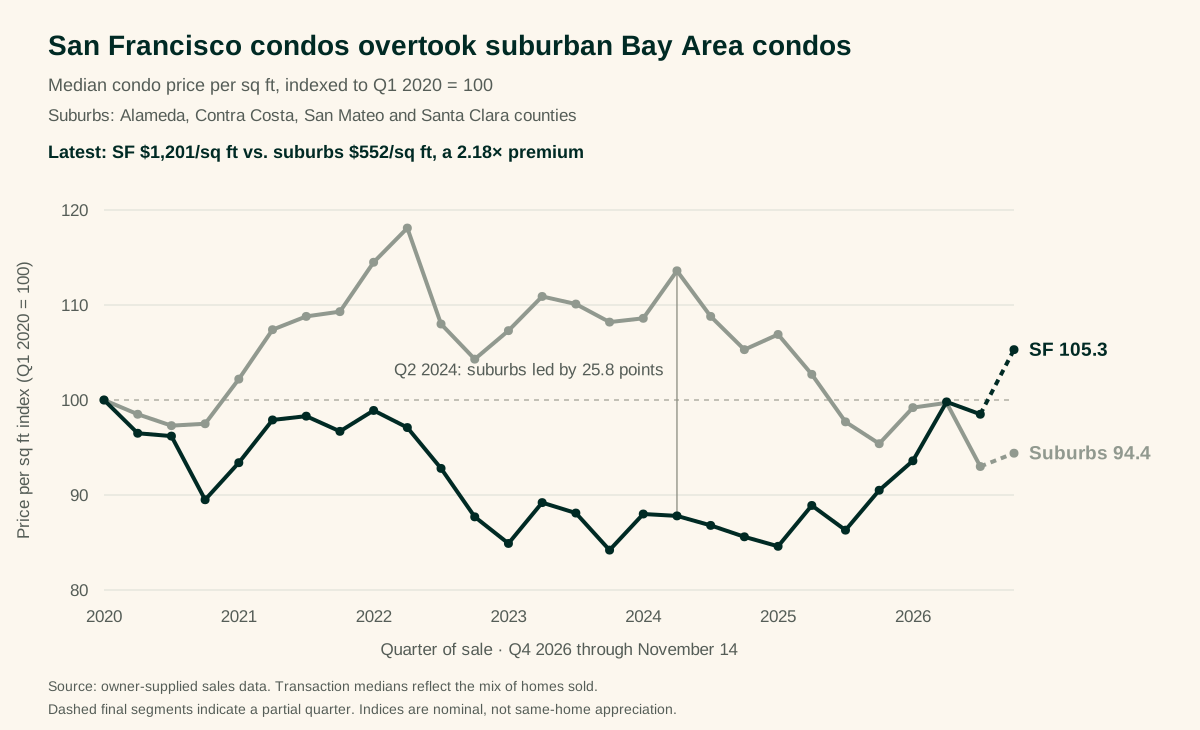
The quarterly median series tells the longer story. With Q1 2020 set to 100, suburban condos reached 113.6 in Q2 2024 while San Francisco stood at 87.8. The suburbs led by approximately 26 index points.
By Q4 2026 through November 14, San Francisco reached 105.3 and the suburban group stood at 94.4. San Francisco's quarterly median was above its early-2020 level, while the pooled suburban median was below it.
| Period | SF median $/sq ft | Suburban median $/sq ft | SF sales | Suburban sales |
|---|---|---|---|---|
| Q1 2020 | $1,140 | $584 | 370 | 1,414 |
| Q2 2024 | $1,001 | $664 | 524 | 1,485 |
| Q3 2026 | $1,124 | $544 | 534 | 1,198 |
| Q4 2026 through Nov. 14 | $1,201 | $552 | 293 | 501 |
The $544 suburban median in Q3 2026 was the lowest quarterly observation in the supplied series. This is a pooled result for Alameda, Contra Costa, San Mateo and Santa Clara, not a claim that every county or individual condo is below its 2020 value.
What does a San Francisco condo cost per square foot?
The median was $1,201 in Q4 2026 through November 14, compared with $552 for the pooled suburban group. That puts the San Francisco premium at approximately 2.18 times the suburban figure, the widest spread in the supplied quarterly series. The ratio was approximately 1.51 in Q2 2024.
For scale, 800 square feet multiplied by $1,201 equals $960,800. That is arithmetic to explain the metric, not an appraisal or a typical sale price for an 800-square-foot condo. Neighborhood, building, floor, light, outdoor space, condition and parking can produce very different values.
The Q4 observation covers only part of the quarter. Its 293 San Francisco closings should not be compared with a full quarter's sales count as evidence of a volume decline.
Are San Francisco condos selling above asking price?
In the supplied 2026 summary, 57.8% closed above their original asking price, up from 35.9% in 2025. Median days on market fell from 30 to 15.
Those figures point to stronger competition. They do not establish how many offers each property received. An above-asking sale can also reflect the seller's initial pricing strategy.
Santa Clara moved in the other direction: the share selling above original asking fell from 34.5% to 24.8%. Approximately three in four closings were therefore at or below original asking. Buyers there may find more negotiating room, although the individual listing still matters.
What should a first-time condo buyer do now?
Start with a monthly ownership budget before choosing an offer ceiling. Mortgage payments, property taxes, HOA dues, insurance and maintenance all affect affordability. A lower purchase price can come with a more expensive building budget.
Compare recent closed sales in the same building and nearby genuinely comparable buildings. Treat original asking price as the seller's opening position. An offer above that figure can still be supported by comparable sales, while an offer below it can still be expensive.
Review the HOA's finances and planned work alongside the unit itself. A renovated kitchen does not tell you whether the building faces roof, exterior, elevator or insurance costs. Ask your lender to review the condominium project early, and preserve enough cash after closing to handle ownership expenses.
Use these related guides to take the next step:
- Buying a home in San Francisco.
- Downtown condo monthly costs.
- SoMa and Mission Bay condo due diligence.
- Rent versus buying a San Francisco condo.
Should you buy now or wait?
This dataset cannot tell you whether prices will be higher next year. It does show that waiting for the entire San Francisco condo market to remain weak is increasingly at odds with the 2026 evidence.
The practical recommendation is to prepare early and remain selective. Set a comfortable monthly budget, understand the building, and make an offer grounded in comparable sales. A faster market makes preparation more valuable. It does not make an unsuitable condo a better purchase.
Common questions
Are San Francisco condos back above 2020 prices?
The Q4 2026 median price per square foot through November 14 was 5.3% above Q1 2020 in the supplied quarterly series. That does not mean every condo has recovered its earlier value.
Are Bay Area suburban condos cheaper than in 2020?
The pooled suburban median was $552 per square foot in Q4 2026 to date, compared with $584 in Q1 2020. The comparison combines four counties and can change with the mix of sales.
Does the 12.4% increase mean my condo appreciated by that amount?
No. It describes the supplied same-ZIP sales comparison across reporting periods. An individual home's value requires property-specific comparable sales and building analysis.
Is the AI boom causing the rebound?
The supplied figures show a geographic divergence. They do not isolate its cause or establish how much AI-related employment or wealth contributed.
Methodology
The owner supplied the summary and quarterly series; underlying transactions and full same-ZIP weighting methodology were not supplied for independent verification. Annual changes compare January 1 through November 14 in 2026 and 2025. Quarterly values are transaction medians indexed to Q1 2020 = 100, not the same measure as annual same-ZIP changes or same-home appreciation. Suburbs pool Alameda, Contra Costa, San Mateo and Santa Clara. North Bay is excluded because supplied earlier condo history is limited. Q4 2026 is partial through November 14. Annual competition and days-on-market figures follow the supplied summary; annual sample counts were not provided. These data do not establish AI-related causation or predict future prices.